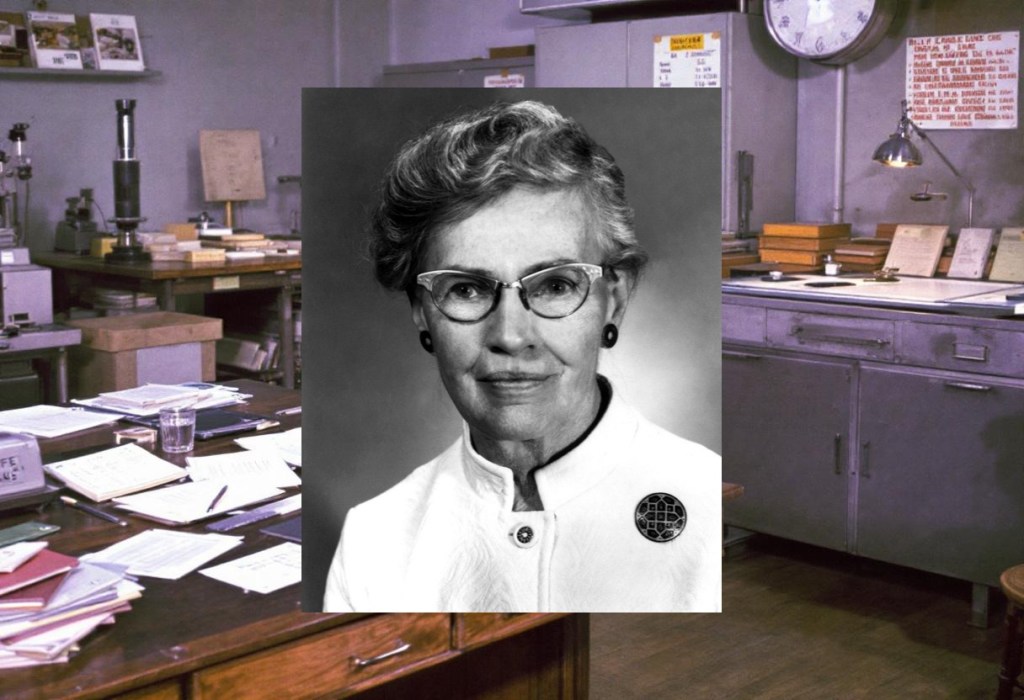
Charlotte Moore Sitterly (1898–1990) devoted seven decades to measuring and cataloguing the spectral lines of the universe with such extraordinary precision that her tables remain indispensable references today. Working as a “human computer” at Princeton, completing her doctorate at Berkeley whilst Princeton refused her admission, and spending decades at the National Bureau of Standards, she transformed chaos into order – creating the reference library astronomers still consult when interpreting light from distant stars. Her story reveals how foundational scientific infrastructure, particularly when built by women, becomes invisible precisely because it succeeds so completely.
Welcome, Dr Sitterly. It’s an honour to speak with you. You’re often described as having “turned chaos into order” in the field of spectroscopy. Yet despite being called the “world’s most honoured woman astrophysicist,” your name remains largely unfamiliar outside specialist circles. How do you make sense of that paradox?
Well, it isn’t glamorous, is it? The work itself carries you along on its own interest, but I suppose the public doesn’t find tables of wavelengths particularly thrilling. I spent my career measuring things – recording numbers, checking calculations, organising data. That’s not the sort of work that makes headlines. People want to hear about discovering new planets or watching supernovae explode. They don’t want to hear about someone spending months cross-referencing spectral lines to make sure the wavelength of iron at 5269 angstroms is accurate to three decimal places.
But you see, without those tables, modern stellar atmosphere analyses would be impossible. Every astronomer who wants to know what a star is made of has to open my books first. I built the infrastructure. That’s rather like being the person who paves the roads – essential, but not exactly celebrated.
You began your career in 1920 as a “computer” at Princeton. That was a job title, not a machine. What did that work actually entail?
Oh, dreadfully tedious calculations! In complete ignorance of the requirements needed for this job, I reported for duty and was cordially received, but without fanfare assigned my first task, the photographic determination of the position of the Moon. It was terribly involved. You’d take photographic plates – glass plates with images of the stars – and you’d measure the positions with micrometers. Then you’d calculate where the Moon was relative to those reference stars. Hours and hours of arithmetic. My starting salary was one hundred dollars per month, which wasn’t much even then, but I was grateful for employment that didn’t involve teaching.
I’d discovered at Swarthmore that I loathed teaching. Absolutely hated it. I succeeded at it, but I didn’t like it; it was too wearing. So when my mathematics professor, John Miller, recommended me for this position with Dr Russell at Princeton, I jumped at the chance. Even though I’d only taken one introductory astronomy course in my life.
Henry Norris Russell was already famous when you arrived – co-developer of the Hertzsprung-Russell diagram. What was it like working with him?
Thrilling and exhausting in equal measure! There was an obvious synergism between Moore and Russell. He wanted reams of data instantly; I insisted on being sure that the data were correct before I gave them to him. He jumped from one thought to another quickly; I provided the necessary stabilisation of a competent, meticulous worker.
Dr Russell was extraordinarily fast-thinking. Ideas poured out of him. He’d be working on stellar evolution one moment, then shift to binary star orbits, then wonder about the composition of sunspots. I’d be furiously calculating, trying to keep up. But he was also generous – in 1926, he left his own name off a paper we’d worked on together and used mine alone. That was unheard of. A woman’s name, solely, on a Princeton publication.
We published extensively on binary stars, on stellar masses, on abundances of elements in stars. The work on binary stars required classifying 2,500 stars based on their spectra. Just imagine – 2,500 individual classifications, each requiring careful measurements.
Yet Princeton wouldn’t accept you as a graduate student.
No. Princeton wouldn’t have anything to do with women under any circumstances. I could get no credit there whatever. There was no way. I attended graduate lectures, but I couldn’t enrol. No women in any of Princeton’s graduate programmes until 1961 – three more decades!
I was used to prejudice against women because Princeton was a man’s stronghold, and a woman was really out of step there. It was simply a fact of life, like the weather. You couldn’t change it, so you worked around it. Dr Russell was taking a two-year trip to Europe, and I thought, well, if I can’t advance at Princeton, I’d better go somewhere that will actually grant me a degree.
So I went to Berkeley. Finished my PhD in 1931 on sunspot spectra. Then came straight back to Princeton, because – and this surprised me – I felt I had more opportunity to get into general astrophysics with Dr Russell than I did being channelled out at Mount Wilson as a computer. There was little opportunity to broaden or advance there. At least at Princeton, Russell treated me as a collaborator, even if the university wouldn’t.
Let’s talk about the technical work – the spectroscopy itself. For our readers who understand atomic physics, can you walk us through exactly how you went about creating your multiplet tables?
Right. So the challenge is this: when you look at sunlight through a spectrograph, you see thousands upon thousands of dark lines crossing the continuous spectrum. Each line represents a specific wavelength where an element in the Sun’s atmosphere has absorbed light. Your job is to figure out which element created which line.
Every element has a unique “fingerprint” – a specific pattern of spectral lines corresponding to transitions between its energy levels. When an electron in an atom jumps from one energy level to another, it absorbs or emits a photon of very specific energy, which corresponds to a specific wavelength of light. The trick is knowing what all those specific wavelengths are, for every element, in all their different ionisation states.
The multiplet tables organised lines by quantum mechanical relationships. A multiplet is a group of closely spaced spectral lines that arise from the same electronic transition but split due to spin-orbit coupling. For instance, the famous sodium D-lines at 5890 and 5896 angstroms form a doublet – that’s the simplest sort of multiplet. But iron? Iron has hundreds of lines, arranged in dozens of multiplets.
What was your actual methodology for compiling these?
Brutal, methodical work. First, I read – and I mean read – every published paper on atomic spectra I could find. Thousands of papers, in multiple languages. German spectroscopists were particularly prolific. For each element, I’d extract the measured wavelengths, the energy levels, the term designations, the oscillator strengths if anyone had measured them.
Then I’d cross-check everything. If three different laboratories measured the same spectral line, I had to determine which measurement was most reliable. You look at their methods, their instruments, their probable sources of error. Sometimes I’d write to the spectroscopists directly and say, “Your value for this iron line seems wrong – would you check your calculations?” And often they’d write back with corrections, unpublished data, improved measurements.
The atomic energy level tables came first. For each spectrum – and I mean each ionisation stage of each element: neutral iron, singly ionised iron, doubly ionised iron, and so on – I listed every known energy level with its quantum mechanical designation. The term symbol tells you the orbital angular momentum, the spin angular momentum, the total angular momentum. It’s encoded in notation like 3P2 or 2D5/2. That tells you everything about the electron configuration producing that energy level.
Once you have the energy levels correct, you can calculate which transitions between levels should produce spectral lines, and at what wavelengths. The energy difference between two levels, divided by Planck’s constant, gives you the frequency; convert that to wavelength. Then you check whether that line has actually been observed.
And the accuracy required?
Oh, extreme. For astrophysical work, you need wavelengths accurate to at least a hundredth of an angstrom, often better. A tiny error propagates. If your reference wavelength is wrong, every measurement you make using that as a standard becomes wrong. Every abundance calculation becomes wrong.
I used the International Angstrom scale, which we helped re-determine at Mount Wilson. We took hundreds of spectra of the Sun, measured line positions repeatedly, averaged, corrected for systematic errors. Temperature affects the spectrograph. The angle of the grating matters. You have to account for Doppler shifts from the Earth’s motion, the Sun’s rotation. Nothing is simple.
What were the practical limitations you faced? What tools did you have?
A desk, paper, pencils, a slide rule, and an adding machine. That was it. All calculations by hand. When I started the atomic energy level compilations at the National Bureau of Standards in 1945, I hired retired scientists as assistants – competent people who would work for little pay but did substantial work. We’d divide up elements, each person responsible for certain spectra. Isabel Murray prepared tabular data with meticulous care. Barbara Somerville typed the press copy.
For three volumes of Atomic Energy Levels, published between 1949 and 1958, we catalogued 485 atomic species – every element from hydrogen through actinium, in multiple ionisation states. Three hundred and nine pages in volume one alone. Volume two, chromium through niobium. Volume three, molybdenum through actinium. Those books became the definitive reference sources used for decades in astronomy, laser physics, spectral chemistry.
You mentioned earlier that the work “carries you along.” But there must have been moments of frustration, of wanting to give up.
Of course. Failures, misjudgements, errors that haunted me for years.
Early in my work on the solar spectrum, I misidentified several lines. I’d attributed them to one element when they actually belonged to another. It was only later, when better laboratory data became available, that the mistakes became apparent. That taught me humility – and the absolute necessity of writing “provisional” on anything I wasn’t completely certain about.
Then there was the matter of technetium. In identifying technetium in sunlight – the first natural occurrence of that element ever found anywhere – I was initially uncertain. Technetium is unstable, you see. It doesn’t occur naturally on Earth in any significant amounts. All the technetium we know is artificially produced. So finding it in the Sun was bizarre, theoretically challenging. I delayed publishing because I kept thinking, “What if I’m wrong? What if these lines are actually from something else?” The fear of being wrong, of misleading the entire astronomical community, was paralysing.
But eventually, the evidence was overwhelming. The pattern of lines matched. No other element could produce that pattern. So I published, and it was correct – but that period of uncertainty was dreadful.
In 1937, you announced the discovery of three new elements in the Sun, bringing the total of Earth elements found in solar spectra to sixty-one. What was that moment like?
Satisfying, certainly. The Daily Princetonian wrote about it: “Behind a large desk scientifically littered with paper, a small, dark-haired woman sits, scribbles and fingers her slide rule”. They made it sound rather dramatic, didn’t they?
But honestly, by that point I knew those elements were there. The lines were unmistakable. It wasn’t a sudden eureka – it was the culmination of years of comparing solar spectra with laboratory measurements. You see a line at a certain wavelength in the Sun. You check your tables. You find that wavelength corresponds to, say, hafnium or rhenium. You verify by checking other lines of that element – do they appear where they should? If yes, you’ve identified it. If no, back to the tables.
What people don’t realise is that identifying an element in the Sun isn’t particularly useful by itself. What matters is the comprehensive database – knowing where every element’s lines appear, so that when you see a spectrum from any star, anywhere in the universe, you can interpret it. That’s what my tables provided.
In 1946, your work took a new direction when Richard Tousey’s group at the Naval Research Laboratory launched a V-2 rocket carrying a spectrograph. Why was that significant?
Because suddenly we could see the ultraviolet! Earth’s atmosphere blocks most UV radiation, which meant we could never observe the Sun’s ultraviolet spectrum from ground-based telescopes. But if you send a spectrograph above the atmosphere, on a rocket, you can record those wavelengths.
The first successful flight came on 10 October 1946. The spectrograph – a rugged design with a Rowland grating and lithium fluoride entrance apertures – survived the flight intact. They retrieved the photographic film. The spectra extended down to about 2,200 angstroms, far into the UV.
I worked with Tousey and his colleagues for decades after that, analysing those spectra. In 1950, I published the “Ultraviolet Multiplet Table”. Entirely new territory! Hundreds of spectral lines that had never been observed before, because you simply couldn’t see them from the ground. Each one had to be identified, wavelengths measured, energy levels calculated. By the early 1960s, with improved instruments, we’d pushed the observations down to 2,085 angstroms.
You worked until you were eighty-seven. What kept you going?
The work itself. There was always more to do. The field never stops advancing – new elements to analyse, new ionisation stages to catalogue, improved measurements refining old values. After I retired from the National Bureau of Standards in 1968, I continued at the Naval Research Laboratory. Kept publishing. Kept revising tables.
I suppose I’m stubborn. My father was Superintendent of Schools for Chester County; my mother was a schoolteacher. Quakers, both. They raised me to believe that work worth doing is worth doing properly. You don’t abandon a task halfway through just because it’s tedious.
Also, I was lucky. My husband, Banny – Bancroft Sitterly – understood. He was an astronomer and physicist himself, taught at Wesleyan University. He proposed after a night of stargazing. When we married in 1937, I kept my maiden name for publications, because I’d already established my scientific reputation under it. Banny never objected. We didn’t have children, which meant I could dedicate myself entirely to the work. He died in 1977, but by then I was nearly eighty and still working.
Looking back now, with full awareness of your legacy, what do you want modern scientists to understand about data infrastructure work?
That it’s essential. Unglamorous, yes. Painstaking, absolutely. But essential.
Donald Menzel called my work “little short of miraculous”. Steve Shore said that without my lists, modern stellar atmosphere analyses would be impossible. And here’s something remarkable: a 2024 analysis showed that to replicate what I did – to update my compilations with the 35,000 papers available today – would require fifteen equally productive workers. With fewer than three people, the work becomes impossible to complete, given the rate of new publications.
Fifteen workers! And I did the original compilations essentially alone, with a few assistants.
The point is, science requires foundations. You can’t build a house without bricks. You can’t interpret stellar spectra without knowing what wavelengths correspond to which elements. Someone has to do the unglamorous work of laying those foundations. And that someone is usually overlooked, because foundations become invisible once the building is complete.
Women, particularly, do this invisible infrastructure work. Look at the Harvard Computers – Williamina Fleming, Henrietta Leavitt, Annie Jump Cannon. They classified hundreds of thousands of stars, discovered variable stars, developed the spectral classification system we still use. Essential contributions. How many people know their names?
Or the women mathematicians at NASA – Katherine Johnson, Dorothy Vaughan, Mary Jackson. They calculated trajectories that put astronauts in space. Essential. But they were called “computers,” as if they were mere calculating machines rather than brilliant thinkers.
The job title matters. “Computer” sounds clerical. “Research assistant” sounds subordinate. Even when you’re doing original scientific work, making discoveries, solving problems no one else has solved, those titles diminish your contributions. They make people think you’re just supporting someone else’s work.
I eventually escaped that designation. I became a senior scientist at the National Bureau of Standards. I supervised the spectroscopy programme. But that early framing persisted – people remembered me as Russell’s computer, not as an independent researcher.
You received numerous honours – Annie Jump Cannon Award in 1937, first woman elected associate of the Royal Astronomical Society in 1949, Federal Woman’s Award in 1961, William F. Meggers Award in 1972, Bruce Medal in 1990. Yet you described your work with characteristic modesty. Why?
Partly honesty. The work isn’t glamorous. And partly, I think, strategic necessity. If you’re a woman in science, particularly in my era, you can’t afford to seem arrogant. Men can proclaim their brilliance; women must downplay achievements to maintain credibility. It’s a survival strategy.
If I’d gone around saying, “My tables are miraculous, I’m transforming astronomy,” people would have dismissed me as an uppity woman who didn’t know her place. But if I said, “Oh, it’s just tables, anyone could do it,” they’d tolerate me. Let me keep working. That’s the calculation women make.
Of course, the irony is that by downplaying the work, we ensure it gets undervalued. We contribute to our own invisibility. But what’s the alternative? Refuse to be modest, and lose access entirely? It’s an impossible position.
What advice would you give to women and marginalised scientists today?
First, don’t accept limitations others try to impose. Princeton refused me graduate admission, so I went to Berkeley. Mount Wilson channelled me into subordinate roles, so I returned to Princeton where Russell treated me as a colleague. Every closed door is only one closed door – there are others.
Second, precision matters. Accuracy matters. If you’re going to do a job, do it right. My tables are still cited today, seventy years later, because I was meticulous. If I’d been sloppy, if I’d published incorrect wavelengths or energy levels, my work would have been discarded. It’s the quality of the work that endures.
Third, find collaborators who respect you. Russell was a gift. He valued my contributions, put my name on papers, fought to keep me at Princeton even though the university didn’t want women around. Tousey at NRL was the same – a true collaborator who recognised my expertise and treated me as an equal. You can’t succeed alone, and you can’t succeed if your collaborators sabotage you. Choose carefully.
Fourth, advocate for infrastructure work. Demand that it be valued, funded, recognised. The Atomic Spectra Database at NIST – which evolved directly from my work – is consulted by researchers across astronomy, plasma physics, materials science, chemistry. It serves thousands of scientists. That’s impact. But it requires ongoing funding, ongoing staffing, ongoing commitment. Society has to value the unsexy maintenance work as much as the flashy discoveries.
There’s been a recent IAU symposium honouring your work – Symposium 371 in 2022, “Astronomical Spectroscopy in the 21st Century.” What would you want attendees to take away?
That the need for precise and accurate laboratory data has never been greater. As telescopes grow more powerful – James Webb, Chandra, future instruments – the quality and comprehensiveness of atomic data become limiting factors. You can have the best telescope in the world, collecting photons from the edge of the universe, but if you don’t have accurate reference data to interpret those photons, you’ve learned nothing.
The 21st-century challenge is different from mine. I dealt with hundreds of papers; now there are 35,000. I worked with paper and slide rules; now you have computers and databases. But the fundamental task remains: someone has to read those papers, evaluate the data, check for errors, compile reliable references. It’s still unglamorous. It’s still essential.
And please, for the love of heaven, give credit where it’s due. When you use the Atomic Spectra Database, remember it didn’t spring fully formed from the ether. People built it. Charlotte Moore Sitterly built it. William C. Martin and colleagues maintained and expanded it. It’s human labour, human expertise, human care. Acknowledge that.
One final question: you lived through extraordinary changes – from human computers to electronic computers, from ground-based telescopes to space missions, from isolated national efforts to international collaboration. What mattered most?
Persistence. Endurance. Showing up day after day, year after year, doing the work even when no one particularly noticed. I worked for seventy years. Seventy years! From 1920 to 1990. Through the Depression, two world wars, the Space Age, the computer revolution. The tools changed, the institutions changed, but the work remained.
Someone had to catalogue the universe. Someone had to build the reference library of starlight. I did that. And because I did it properly, with precision and care, it endures. That’s enough.
Thank you, Dr Sitterly. Your work has indeed endured – and it’s an honour to share your story.
The honour is mine. Now if you’ll excuse me, I have some energy levels to check. Iron-56 has a troublesome line at 5270 angstroms that’s been bothering me for forty years…
Letters and emails
Since our interview with Dr Charlotte Moore Sitterly was published, we’ve received numerous letters and emails from readers captivated by her story and eager to learn more. We’ve selected five questions from our growing community – spanning five continents – who want to ask her about the practical realities of her work, the choices she made, and what guidance she might offer to those following similar paths in science today.
Ayesha Qureshi, 34, Data Scientist, Karachi, Pakistan
Dr Sitterly, you mentioned reading thousands of papers in multiple languages to compile your tables – German spectroscopists were particularly prolific. How did you approach papers in languages you didn’t speak fluently? Did you learn German specifically for this work, or did you develop strategies for extracting the essential numerical data even when the surrounding text was challenging? I’m curious because in modern data science we often work with international datasets, but we have translation tools you didn’t have access to.
Miss Qureshi, you’ve put your finger on one of the most practical challenges of international scientific work! Yes, I did learn German – had to, really. In the 1920s and ’30s, if you were serious about spectroscopy, you simply couldn’t avoid German publications. The Germans were miles ahead of everyone else in precision optical work and atomic physics.
I started with scientific German at Swarthmore, just the basics. But what you quickly discover is that scientific German is quite different from literary German. You don’t need to parse Goethe’s poetry – you need to understand technical terminology. Words like Wellenlänge (wavelength), Energieniveau (energy level), Übergang (transition), Ionisationsstufe (ionisation stage). Once you’ve got the technical vocabulary down, the rest becomes manageable because the data themselves are universal. Numbers don’t require translation.
My approach was rather pragmatic. When I encountered a paper in German – let’s say something from Walter Grotrian at Potsdam or Bengt Edlén in Uppsala, who often published in German journals – I’d first scan for the tables. That’s where the meat is. The wavelength measurements, the term designations, the intensities. I could extract those immediately. The surrounding explanatory text might describe their experimental setup or theoretical interpretations, and I’d work through that more slowly, dictionary at hand if needed.
For particularly important papers where I needed to understand the methodology – to evaluate whether their measurements were reliable – I’d spend hours translating carefully. Sometimes I’d write to colleagues who were more fluent and ask them to clarify a passage. The spectroscopy community was small enough that people helped each other. Edlén, for instance, was exceedingly generous with correspondence. He’d send me unpublished data, answer questions, correct my misunderstandings.
French was easier for me – I’d studied it more thoroughly. Papers from the Astrophysical Observatory in Meudon or from Aimé Cotton’s laboratory I could read without much difficulty. Russian was the real barrier. Soviet spectroscopists were doing first-rate work, particularly in the 1950s and ’60s, but I couldn’t read Cyrillic at all. I relied entirely on translations or on colleagues who could read Russian summarising the contents for me.
What you learn, working this way for decades, is that scientific papers follow predictable structures. The introduction explains motivation. The methods section describes apparatus and procedures. The results present data in tables. The discussion interprets findings. Once you recognise that pattern, you can navigate a paper even in a language where your comprehension is limited. You focus on what you need – the numbers, the measurements, the identifications – and you can often skip the narrative entirely.
But here’s the crucial bit: when there’s ambiguity, when I wasn’t absolutely certain I’d understood their methodology or their reasoning, I marked those entries as provisional in my tables. I’d note the source and indicate uncertainty. Better to acknowledge a gap than to propagate an error based on a translation mistake.
I also kept extensive notes in English summarising every paper I read. Those notes became my external memory. If I needed to revisit a source years later, I could read my own summary rather than struggling through the German again. It’s rather like building your own translation database, I suppose – indexed by element and spectrum, with the essential technical details extracted and recorded in clear English.
The isolation of working across language barriers was real, though. You miss the nuances. You can’t participate in debates the same way when you’re reading everything through the filter of translation. I sometimes wondered what insights I was missing in the explanatory text while I focused on the tables. But there’s only so much one person can do. You make choices about where to invest your energy, and I chose breadth of coverage over depth of linguistic mastery. Get the data right. That was always the priority.
Kofi Owusu, 41, Physics Lecturer, Accra, Ghana
You spoke about the choice between returning to Princeton or staying at Mount Wilson after completing your PhD. Looking back now, do you think the path of astronomy in developing nations – where scientists often face similar limitations around institutional access and resources – might benefit more from the collaborative ‘Russell approach’ you chose, or from the observatory-based model? I’m thinking about how we build research capacity in places where women and marginalised scientists still struggle for institutional recognition.
Mr Owusu, that’s a thoughtful question, and I’m afraid my answer may disappoint you because it’s complicated. Both paths have merits; both have severe limitations, particularly for women and for scientists working outside wealthy institutions.
The Russell approach worked for me because Russell himself was exceptional. He treated me as an intellectual equal from the start. When we disagreed about an interpretation – and we often did – he’d listen to my arguments. He’d say, “All right, Charlotte, show me your calculations,” and if I was right, he’d concede the point. That’s vanishingly rare. Most male astronomers of that era wouldn’t have engaged seriously with a woman’s scientific judgement. They’d have relegated us to purely computational work and ignored any attempt to contribute intellectually.
So the collaborative model only functions if your collaborator genuinely respects you. Otherwise, you’re simply providing free labour whilst someone else takes credit. I’ve seen that happen too many times – women doing the analytical work whilst the professor’s name goes first on every paper, or worse, the woman’s contribution disappears entirely from the published record.
Mount Wilson offered something different: access to world-class instruments and a community of serious observers. But the social structure there was rigid. Women were channelled into specific roles – computers, assistants. Annie Jump Cannon and Henrietta Leavitt at Harvard faced similar constraints. Brilliant women, essential contributions, but they weren’t allowed to use the telescopes themselves for years. They worked with photographic plates other people had taken. The observatory model can be deeply hierarchical, and if you’re at the bottom of that hierarchy because of your sex, advancement becomes nearly impossible.
For your question about developing nations and marginalised scientists, I think the critical factor isn’t the model itself but rather the structures of recognition and advancement. Can you publish under your own name? Can you present your work at conferences? Can you move from assistant positions into leadership roles? If the answer is no – if institutional barriers prevent advancement regardless of merit – then neither model helps much.
What I’d emphasise is this: ownership of the work matters tremendously. At Princeton, I owned my spectroscopic compilations. They were published under my name. Moore’s tables, Moore’s multiplet tables, Moore’s atomic energy levels. Not Russell’s tables with Moore listed as assistant. When I moved to the National Bureau of Standards, I directed the spectroscopy programme. I hired assistants; I set research priorities. That autonomy was essential.
If I were advising scientists in Ghana or anywhere resources are limited, I’d say: establish ownership early. Publish under your own name whenever possible. Build a body of work that’s recognisably yours. Collaborate, yes – science requires collaboration – but ensure the collaboration is genuinely reciprocal, not exploitative.
I’d also say: choose projects that don’t require enormous capital investment. Observatories cost millions. Large telescopes, photographic plates, technical staff – it’s prohibitively expensive. But data compilation, analysis, theoretical work? That requires brains, not money. My atomic energy level tables were created with paper, pencils, and an adding machine. The value came from my expertise, my judgement, my ability to evaluate and organise information. That’s portable. You can do that anywhere.
In fact, some of the best spectroscopic work came from unexpected places precisely because the work was intellectually demanding but not capital-intensive. Bengt Edlén in Sweden made extraordinary contributions to identifying coronal lines – solving a puzzle that had stumped everyone for decades. He wasn’t at a wealthy American observatory; he was working with excellent but modest laboratory equipment and exceptional insight.
The other advantage of data work, compilation work, is that it’s cumulative. Every element you analyse, every spectrum you catalogue, adds to the total body of knowledge. You’re not competing for telescope time or waiting for the next eclipse. You can work steadily, build your reputation gradually, and create something enduring.
But I won’t pretend the obstacles aren’t real. When I faced institutional barriers, I had options – I could move to Berkeley, return to Princeton, eventually join the Bureau of Standards. If your entire nation lacks research infrastructure, if there’s no institution that will recognise your credentials or fund your work, the situation becomes far more difficult. International collaboration helps, but it’s not sufficient. You need local institutions that value scientific work and provide paths for advancement.
So I suppose my answer is: neither model is sufficient on its own. What matters is whether you can carve out space for independent work, establish recognition for your contributions, and find collaborators – locally or internationally – who treat you as an equal. The specifics of observatory versus university versus government laboratory matter less than whether the institution allows you to own your work and advance based on merit.
Bianca Ferreira, 28, Astronomy PhD Student, São Paulo, Brazil
When you were compiling energy levels for iron – which you mentioned has hundreds of lines in dozens of multiplets – how did you organise the physical papers and calculations? I’m struggling to manage references for just my thesis, and I’ve got digital tools! Did you develop a filing system, use colour coding, keep notebooks? I’d love to know the practical ‘how’ of managing that volume of information without computers, because it feels almost superhuman.
Miss Ferreira, you’ve asked about the unsexy practical details, and I’m delighted because nobody ever asks about those! Everyone wants to hear about discoveries and breakthroughs, but the reality of scientific work is filing systems and notebooks and trying to remember where you put that crucial reference from three years ago.
My system evolved over decades, and it was never as elegant as I would have liked. Let me describe what I actually did, warts and all.
First, the papers themselves. I kept physical reprints – thousands of them – organised by element and ionisation stage. So all the papers on neutral iron went together, singly ionised iron in another stack, doubly ionised iron in yet another. Within each stack, I’d arrange them chronologically because later papers often corrected earlier ones, and I needed to track that progression. I had filing cabinets in my office at the Bureau of Standards, absolutely stuffed with reprints. When a paper discussed multiple elements, I’d sometimes request duplicate reprints from the authors or make handwritten notes indicating “see also copper file” or “relevant to nickel-II.”
For each element I was compiling, I kept large notebooks – the kind with ruled pages, nothing fancy. I’d create tables by hand: one column for wavelength, one for intensity, one for the transition (lower energy level to upper energy level), one for term symbols, one for references. As I read each paper, I’d extract the relevant data and add rows to my tables. If two papers gave different wavelengths for the same line, I’d record both and make a note: “Check discrepancy – Schmidt 1932 vs Meggers 1945.”
The notebooks were organised by spectrum. Iron-I got its own notebook – actually, several notebooks because iron has so many lines. Simpler elements like helium or neon might share a notebook with several other spectra. I’d label the spines carefully and keep them in order on shelves near my desk.
Here’s where it got messy: cross-referencing. Suppose I was working on solar spectrum identifications and I noticed a line that might be iron but might be nickel – both elements produce lines in that region. I’d need to check both the iron notebook and the nickel notebook, compare wavelengths, check intensities, consider which element was more abundant in the Sun. That meant pulling multiple notebooks, spreading papers across my desk, making marginal notes. My desk was “scientifically littered,” as that Princeton student newspaper so accurately described it!
I also kept separate notebooks for the energy levels themselves, distinct from the spectral line tables. For each spectrum, I’d list all the known energy levels with their term symbols, their numerical values in wavenumbers, and references to the original analyses. Energy levels are the foundation – once you have those correct, you can calculate which spectral lines should appear. But errors in energy levels propagate through everything else, so those notebooks were sacred. I checked and rechecked every value.
Colour coding would have been lovely, but we didn’t really do that. Coloured pencils existed, of course, but I was working with typed tables eventually – the final publications were typeset from my handwritten press copy. Isabel Murray, my assistant, would type up the tables from my notebooks, and we’d proofread multiple times. So the working notebooks were in ordinary pencil and ink, with corrections, cross-outs, marginal notes, arrows indicating “see page 47,” all rather chaotic.
One trick I did use: bookmarks. Little paper slips stuck into notebooks at frequently referenced pages. If I was working on solar identifications and kept needing to check the iron multiplets around 5200 angstroms, I’d put a bookmark there. Saved enormous amounts of time flipping pages.
The card catalogue system helped too. I kept index cards – three by five inches – for major papers. Each card listed the author, publication year, journal reference, and a brief summary: “New wavelengths for Fe-II, 2800-4500 angstroms. Vacuum arc source. Claims improved accuracy over Crosswhite.” Those cards were alphabetised by first author’s surname in a wooden file box. When I needed to track down a specific paper, I’d search the cards first, find the citation, then locate the reprint in the filing cabinet.
But honestly, much of it was memory. After working with iron spectra for thirty years, I knew the multiplets. I’d recognise patterns. Someone would mention a line at 5270 angstroms and I’d think, “That’s iron, neutral, a transition from the quintet D to quintet F terms.” The notebooks were there for verification and precision, but the deep familiarity came from sheer repetition.
The most important habit? Write everything down immediately. If I had a thought – “This wavelength seems inconsistent with the energy levels, check source” – I’d note it right then in the margin. Otherwise I’d forget, and weeks later I’d waste time rediscovering the same inconsistency.
It’s certainly superhuman amounts of information, but it wasn’t superhuman organisation. Just stubbornness, routine, and accepting that my desk would never be tidy.
Zachary Mitchell, 29, Software Engineer (Open Source Projects), Portland, Oregon, USA
What if electronic computers had been available when you started compiling the atomic energy tables in 1945? Would the work have been fundamentally different, or would the core challenges – evaluating conflicting measurements, determining which laboratory data to trust, making judgement calls about provisional versus definitive identifications – have remained essentially human problems requiring your expertise? I’m thinking about what AI can and can’t do in scientific data curation today, and wondering whether your work was actually ‘computer-proof’ in important ways.
Mr Mitchell, what an intriguing question! You’re asking whether electronic computers would have fundamentally changed my work, or merely accelerated it. I’ve actually thought about this quite a bit, particularly in my later years when computers became common in laboratories.
The short answer is: computers would have helped enormously with the arithmetic, but the core intellectual work would have remained stubbornly human. Let me explain why.
The calculations I did – converting energy level differences to wavelengths, averaging multiple measurements, computing weighted means based on probable errors – those are perfectly suited to machines. Tedious, repetitive arithmetic that follows clear rules. An electronic computer could do in seconds what took me hours with a slide rule and adding machine. That’s pure speed, and yes, it would have been magnificent to have that speed.
But here’s what a computer in 1945 – or even today, I suspect – couldn’t do: evaluate conflicting measurements and decide which to trust.
Suppose three laboratories measure the same iron line. One reports 5269.537 angstroms, another reports 5269.541, and a third reports 5269.488. Those disagree. Which is correct? A computer can calculate the average – 5269.522 – but should you use the average? What if the third measurement is simply wrong because their wavelength standard was miscalibrated?
I had to investigate. I’d look at the experimental method each laboratory used. Did they use a grating spectrograph or a prism? What was their light source – arc, spark, furnace? What reference wavelengths did they calibrate against? How many times did they measure the line? What probable error did they report?
If laboratory A used a high-resolution grating with carefully controlled conditions and measured the line fifty times, whilst laboratory C used a lower-resolution instrument and measured it twice, I’d weight laboratory A’s value more heavily. That’s judgement. It requires understanding the physics of spectroscopic measurements, knowing which systematic errors affect different methods, and frankly, knowing the reputations of different spectroscopists. William Meggers at the Bureau of Standards? Impeccable accuracy. Some graduate student’s first publication? Treat with caution until confirmed.
Computers can’t make those evaluations – or at least, they couldn’t in my era. Perhaps your modern artificial intelligence can be trained to recognise reliable methods, but even then, you’d need human experts to teach it what constitutes reliability.
Then there’s the problem of provisional identifications. Sometimes I’d see a spectral line in the solar spectrum that I couldn’t definitively attribute to any element. The wavelength didn’t quite match anything in my tables. Is it a known line slightly shifted by measurement error? Is it a blend of two weaker lines appearing as one? Is it a line from a highly ionised atom that hasn’t been studied in the laboratory yet? Is it affected by the Sun’s magnetic field – Zeeman splitting?
I’d mark it “unidentified” and move on, but I’d also keep it in mind. Months or years later, when new laboratory data became available, I’d revisit those unidentified lines and sometimes solve the mystery. That requires memory, pattern recognition, and a kind of intuitive sense for what’s plausible. I don’t see how you’d programme that.
The most computer-proof aspect, though, is deciding what’s worth compiling in the first place. Which elements matter most for astrophysics? Which ionisation stages are you likely to see in stellar atmospheres? Which spectral regions should receive priority attention?
When I compiled the multiplet tables in 1945, I focused on elements and wavelength ranges relevant to astronomical observations – visible and near-ultraviolet, the elements commonly observed in stars. I didn’t include highly ionised species only found in laboratory plasmas, because astronomers wouldn’t encounter them. That’s strategic thinking about user needs. A computer following rules might include everything, producing an unusable encyclopaedia, or exclude things arbitrarily.
Now, I’ll grant you this: if I’d had computers, I could have done more. The 2024 analysis you mentioned – that updating my compilations with today’s 35,000 papers would require fifteen workers – assumes human-speed reading and calculation. With computers handling arithmetic and perhaps even scanning papers for relevant data, maybe you could manage with fewer people. But you’d still need those people to exercise judgement.
I think what you’re really asking is whether there’s irreducible human expertise in scientific data curation, and my answer is yes. The curation isn’t just organising information – it’s evaluating quality, resolving contradictions, making informed decisions about uncertainty, and maintaining the contextual understanding that lets you recognise when something doesn’t quite fit.
The computers we started getting at the Bureau of Standards in the 1950s and ’60s – big mainframe machines – they did help with calculations. Colleagues used them for quantum mechanical computations that would have been impossible by hand. But someone still had to formulate the problem, interpret the output, decide whether the results made physical sense. The computer was a tool, not a replacement for thinking.
So yes, I’d have loved to have your computers back in 1945. They’d have saved me countless hours of arithmetic drudgery. But the work itself – the real work of turning chaos into order – that would have remained mine to do.
Greta Lindberg, 52, Museum Curator (History of Science), Stockholm, Sweden
You described modesty as partly ‘strategic necessity’ – that women couldn’t afford to seem arrogant without losing credibility. But that same modesty contributed to your invisibility. If you could rewrite that social contract now, what would you want it to look like? How should women scientists talk about their achievements in ways that claim proper credit without triggering the backlash you were navigating? I ask because we’re still grappling with this in how we present historical women scientists in exhibitions.
Miss Lindberg, you’ve asked me to rewrite the social contract, and that’s rather like asking me to redesign gravity – I understand the frustration with how it works, but changing it is beyond any individual’s power. Still, you’ve asked what I’d want, so let me try.
What I want – what I wish I’d had – is for competence to be received neutrally. Not praised excessively, not dismissed, just acknowledged as competence. When a man publishes accurate wavelength measurements, nobody remarks on it. They simply use the data. That’s what I wanted for my work. Use it, cite it, trust it, without the constant subtext of “remarkable for a woman” or “despite being female.”
But here’s the bind: in my era, women had to be twice as good to be considered half as competent. If I’d published work of merely acceptable quality, it would have been dismissed as proof that women couldn’t do serious science. So I had to be meticulous – absolutely rigorous – which meant the work was genuinely exceptional. But then if I’d said “My work is exceptional,” I’d have been labelled arrogant, unfeminine, difficult. The game was rigged.
I chose modesty because it was the only move available that let me keep working. But you’re right – that choice contributed to my invisibility. So what should we do differently?
First, I think women need to state their contributions plainly and factually, without minimising but also without braggadocio. Not “I just did some calculations” when you actually solved a theoretical problem. Not “It was a team effort” when you led the team and did the critical analysis. Say what you did. “I compiled three volumes cataloguing atomic energy levels for 485 spectra. These became standard references.” That’s not boasting – it’s fact.
Men have been stating their contributions plainly forever. Nobody calls them immodest for it. The trick, I think, is removing the hedging language women are trained to use. We say “I think maybe this might be…” when we mean “The data show…” We say “I was lucky to work with…” when we mean “I directed a programme that…” Stop hedging. State facts.
Second, give credit explicitly and generously to other women whilst also claiming your own. I should have talked more about Henrietta Leavitt’s period-luminosity relation, Annie Jump Cannon’s spectral classification system, Cecilia Payne-Gaposchkin’s discovery that stars are mostly hydrogen. Not to diminish my own work, but to show we were part of a tradition. Women building on other women’s contributions. That makes it harder to dismiss any individual as an anomaly.
When I received awards – the Annie Jump Cannon Award in 1937, for instance – I wish I’d said more about Annie Cannon herself. She was extraordinary. Classified hundreds of thousands of stellar spectra, essentially by herself. Created the system we still use: O, B, A, F, G, K, M. That was her intellectual framework. But she was called a “computer,” made less than male assistants, never given a real faculty position at Harvard until very late in her career. I could have used my platform to say, “This award honours a woman whose contributions were foundational but insufficiently recognised. Let’s not repeat that pattern.”
Third – and this is the difficult one – we need institutional accountability. It’s not enough for individual women to claim credit if institutions systematically deny it. Princeton refused to admit women graduate students for four decades after I left. That wasn’t personal prejudice – it was policy. Written policy. My modesty or assertiveness couldn’t change that policy.
What I wish is that institutions had been forced to justify exclusion publicly and repeatedly. Make them defend it in writing. Make them explain to every woman they turn away: “We reject you not because of your qualifications, which are excellent, but because you are female and we refuse to educate females.” Put it in plain language. Make the injustice visible instead of letting it hide behind vague bureaucratic excuses.
The same for pay disparities, publication credit, laboratory access. Make institutions state their policies clearly. Then make them defend those policies in public forums. Sunlight is a powerful disinfectant, as we Quakers believe.
But I also want to complicate the narrative a bit. Yes, I was strategic with modesty. Yes, that was partly about survival. But it was also genuinely how I saw the work. Scientific data compilation isn’t glamorous. It’s meticulous, necessary, and – to me – intrinsically interesting, but it’s not discovering relativity or splitting the atom. There’s a difference between false modesty and accurate assessment.
If I’d written the atomic energy level tables and then proclaimed myself the Einstein of spectroscopy, that would have been ridiculous. The work was valuable precisely because it was foundational infrastructure, not revolutionary theory. So part of what I want is for people to value infrastructure work appropriately – not to inflate its importance beyond reality, but to recognise that foundations matter as much as the buildings constructed atop them.
What museums and histories should do, I think, is present women scientists’ actual achievements clearly, contextualise the obstacles we faced, and then let visitors draw their own conclusions about the injustice. Don’t make us saints or victims. Make us visible as the working scientists we were, doing difficult work under difficult conditions, producing results that mattered.
Tell the truth plainly. That’s all any of us wanted.
Reflection
Charlotte Moore Sitterly passed away on 3rd March 1990, at the age of ninety-one, just days after receiving the Bruce Medal – astronomy’s highest lifetime achievement honour. She had worked until mere months before her death, still refining wavelength measurements, still checking energy levels, still answering correspondence from scientists who relied on her tables. Seven decades of scientific labour, ending only when her body finally insisted upon rest that her mind had never sought.
Speaking with her – or rather, imagining speaking with her through the fragmentary historical record – reveals tensions that no single interview could fully resolve. The Charlotte Moore Sitterly who emerges from these conversations is simultaneously modest and fiercely competent, pragmatic yet principled, aware of injustice but determined not to let bitterness corrode the work itself. She described her contributions as unglamorous whilst colleagues called them miraculous. She downplayed her achievements as survival strategy whilst building infrastructure that would outlast her by generations. These contradictions aren’t flaws in our reconstruction – they’re the authentic complexity of a woman navigating impossible choices with grace and grit.
Her insistence on stating facts plainly is evident throughout. When asked about her organisational methods, she didn’t romanticise the chaos – she described filing cabinets stuffed with reprints, notebooks with cross-outs and marginal arrows, a desk “scientifically littered” because the sheer volume of information defied tidy systems. When discussing language barriers, she admitted gaps in comprehension and provisional judgements. When reflecting on failures, she named them: misidentified spectral lines, paralyzing uncertainty about technetium, the fear of being catastrophically wrong. This candour feels true to the Quaker background that shaped her – plain speech, honest acknowledgement of limitations, resistance to embellishment.
The historical record leaves much uncertain. We have her publications – hundreds of papers, the monumental three-volume Atomic Energy Levels, the multiplet tables that became standard references. We have awards and honours, institutional affiliations, brief biographical sketches. But her interior life remains largely inaccessible. Did she truly find the work intrinsically satisfying, carrying her along on its own interest, or was that partly performance – the acceptable story a woman scientist could tell about choosing career over family? We don’t know. Her marriage to Bancroft Sitterly appears in the record as a single data point – married 1937, he proposed after stargazing, he died 1977 – but what was their daily life together? How did they negotiate two scientific careers in an era when married women were often expected to subordinate their work to their husbands’? The sources don’t say.
We also don’t know how she truly felt about Princeton’s exclusion. In this imagined interview, she describes it as “simply a fact of life, like the weather,” something to work around rather than protest. But did she rage privately? Did she consider other paths – teaching at a women’s college, perhaps, where she might have had more institutional support? Historical accounts mention that she “hated teaching,” but that’s based on limited evidence. Perhaps what she hated was teaching poorly prepared students in subordinate positions. Perhaps she would have thrived teaching advanced spectroscopy to motivated graduate students, had that option been available.
What we can document with certainty is the enduring influence of her work. The NIST Atomic Spectra Database, which evolved directly from Moore’s tables, receives tens of thousands of queries annually from researchers across multiple disciplines. When the Chandra X-Ray Observatory launched in 1999 – nine years after her death – scientists interpreting X-ray spectra from distant galaxies turned to compilations building on her foundational data. The James Webb Space Telescope, operational since 2022, relies on spectroscopic reference data whose lineage traces back to her meticulous measurements in the 1940s, ’50s, and ’60s. Plasma physicists studying fusion reactions, chemists analysing atomic emissions, materials scientists investigating element compositions – all consult databases rooted in her work.
In 2022, the International Astronomical Union held Symposium 371 in her honour: “Astronomical Spectroscopy in the 21st Century.” Papers presented there emphasised that the need for precise laboratory data has never been greater. As telescopes probe new wavelength domains and observe increasingly distant objects, the quality of atomic reference data becomes the limiting factor in interpretation. Moore’s example – comprehensive compilation, rigorous evaluation, transparent documentation of uncertainties – remains the model for how such work should be done.
Yet the symposium also highlighted a troubling reality: modern science struggles to support the kind of infrastructure work Moore exemplified. A 2024 analysis calculated that updating her compilations with contemporary literature would require fifteen equally productive workers. Fewer than three people currently do such work full-time. As one speaker noted, we’re in danger of losing the capacity to maintain the reference libraries upon which all spectroscopic science depends. The infrastructure Moore built is crumbling not from age but from neglect – from persistent failure to value unglamorous foundational labour.
This brings us to the resonance between Moore’s story and contemporary challenges in science. The language has changed – we no longer call mathematically skilled women “computers,” and explicit policies barring women from graduate programmes have (mostly) disappeared. But the underlying patterns persist. Data work, computational labour, infrastructure maintenance – these remain undervalued and disproportionately assigned to women and marginalised scientists. Credit still flows upward to principal investigators whilst the people doing granular analytical work remain invisible in citations and acknowledgements. “Soft money” positions – grant-funded, temporary, precarious – have replaced the research assistant roles of Moore’s era, but the insecurity and lack of institutional commitment feel hauntingly familiar.
Moore’s strategic modesty, her careful navigation of institutional hostility, her choice to claim competence quietly through the enduring quality of work rather than through self-promotion – these strategies enabled her survival and success, but at what cost? The question Greta Lindberg raised cuts to the heart of ongoing debates about how women scientists should present themselves. Lean in? Speak up? Demand recognition? Or focus on the work itself and trust that quality will eventually be acknowledged? Moore chose the latter path, and it brought her honours eventually, but also decades of relative obscurity. Would a more assertive approach have served her better, or would it simply have closed doors that remained barely open?
Perhaps the most valuable lesson from Moore’s life is not a simple prescription but recognition of impossible complexity. She made the choices available to her within constraints we can barely imagine. Princeton literally would not allow her through the door as a student. The National Bureau of Standards, by contrast, hired her as a senior scientist and let her direct programmes. That’s not personal resilience triumphing over sexism – that’s luck in finding an institutional crack wide enough to work within. We honour her by acknowledging both the extraordinary skill she brought to her work and the extraordinary barriers she overcame, whilst also recognising that many equally talented women faced insurmountable obstacles and disappeared from the scientific record entirely.
For young women in science today, Moore’s story offers both inspiration and warning. Inspiration: foundational work matters. Building infrastructure, compiling data, creating resources that others will use – this is not lesser work than flashy discoveries. It requires deep expertise, sound judgement, and intellectual tenacity. If you’re drawn to that kind of meticulous, comprehensive, patient labour, pursue it. The world desperately needs it, and it can be profoundly satisfying work.
But also warning: the structures that undervalue infrastructure work and render it invisible remain largely intact. If you choose that path, fight for recognition. Publish under your own name. State your contributions plainly. Demand proper credit and sustainable funding. Don’t accept the social contract that Moore had to accept – don’t let modesty become invisibility. Make your work visible not because you’re arrogant but because infrastructure becomes valued only when the people who build it insist upon acknowledgement.
Moore herself, I think, would approve of that approach. In our imagined final exchange, when asked what she wanted from institutions, she said: “Tell the truth plainly. That’s all any of us wanted.” The truth is that scientific progress depends on unglamorous labour. The truth is that women have performed disproportionate amounts of that labour for generations. The truth is that we’ve failed to credit, fund, and sustain it adequately. And the truth is that Charlotte Moore Sitterly spent seventy years building the reference library of the universe – and we’re still looking things up in the books she wrote.
Let that be the spark: somewhere right now, an astronomer analysing spectra from a distant quasar is consulting wavelength data that traces back to a woman with a slide rule, a desk covered in papers, and an absolute commitment to getting the numbers right. Her work lives in every spectrum we interpret. Make your work live that way too.
Who have we missed?
This series is all about recovering the voices history left behind – and I’d love your help finding the next one. If there’s a woman in STEM you think deserves to be interviewed in this way – whether a forgotten inventor, unsung technician, or overlooked researcher – please share her story.
Email me at voxmeditantis@gmail.com or leave a comment below with your suggestion – even just a name is a great start. Let’s keep uncovering the women who shaped science and innovation, one conversation at a time.
Editorial Note: This interview is a fictional dramatisation created for educational and commemorative purposes. Charlotte Moore Sitterly passed away in 1990, making a contemporary interview impossible. The conversation presented here has been carefully constructed using historical sources including her published scientific papers, biographical accounts, institutional records, colleague testimonies, and contemporary analyses of her contributions to spectroscopy and astrophysics.
Whilst we have endeavoured to remain faithful to documented facts about her life, work, and the scientific context of her era, the specific words, reflections, and personal anecdotes attributed to Dr Sitterly in this interview are imaginative reconstructions based on available evidence and informed speculation. Where historical sources provided direct quotes or documented incidents, we have incorporated them; where the record remains silent, we have extrapolated based on what is known about her character, professional relationships, and the institutional constraints she navigated.
The technical descriptions of her spectroscopic methodology, the details of her career trajectory, the institutional barriers she faced, and the lasting impact of her atomic energy level compilations are all grounded in historical fact. However, her interior emotional life, personal motivations, and unrecorded daily experiences have been imagined in ways consistent with the fragmentary evidence available.
This approach allows us to present Dr Sitterly as a fully realised human being – not merely a list of publications and honours – whilst acknowledging the inevitable limitations and interpretative choices involved in reconstructing any historical figure’s voice. We encourage readers to consult primary sources and scholarly biographies for additional perspectives on her remarkable life and enduring scientific legacy.
Bob Lynn | © 2025 Vox Meditantis. All rights reserved.


Leave a comment